
Zabbix explained: what it is, what it does, how to start
Zabbix is open source monitoring: its components, how alerts work, how it differs from Graylog, which LTS release to run and how to size its database.
By UNIXDEV Team · 13 min read
Original published · English edition
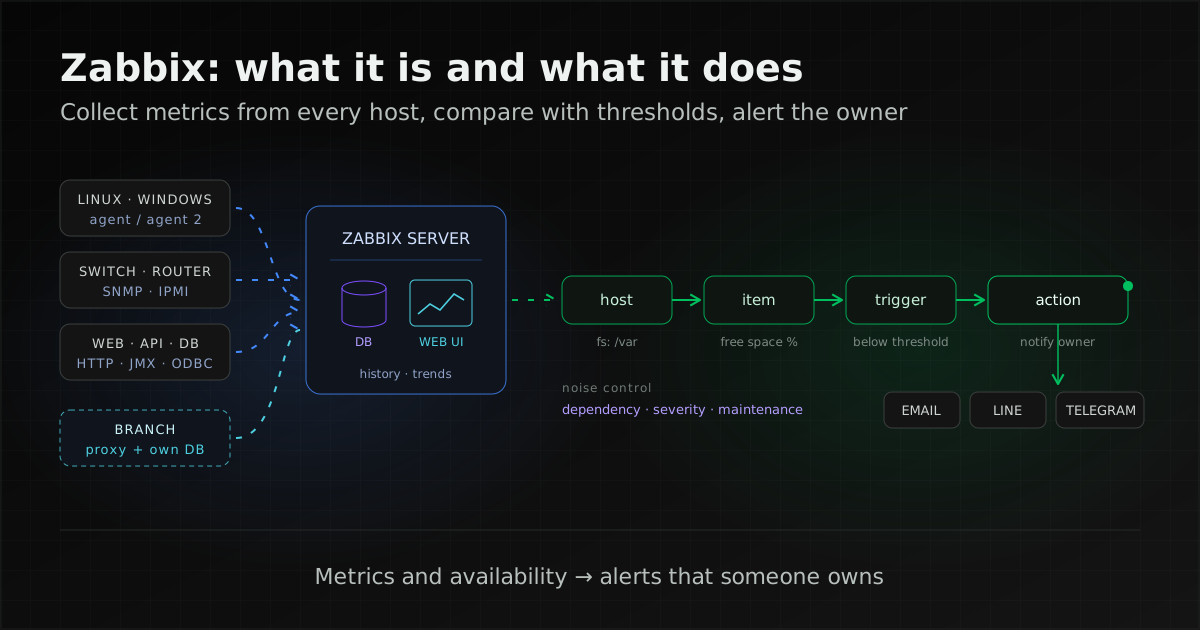
Zabbix is open source monitoring software that collects metrics and availability data from servers, network devices, virtual machines, databases, websites and services in one central place, and raises alerts when a value crosses a threshold you define. It can be downloaded and installed for free; the real work is deciding what to watch, where to set thresholds and who receives each alert.
The Zabbix manual describes the product as "an enterprise-class open source distributed monitoring solution" that watches network parameters and the health and integrity of servers, virtual machines, applications, services, databases, websites and the cloud.
What is Zabbix made of, and how does it work?
Zabbix has four main parts: the server, the database, the web frontend and the agents on monitored machines, plus optional proxies. According to the Zabbix 8.0 overview, the server is the central component to which agents report availability, integrity information and statistics, and all configuration and gathered data is stored in the database.
| Component | Role |
|---|---|
| Zabbix server | Receives data from agents and proxies, evaluates triggers and sends notifications |
| Database | Stores all configuration and collected data |
| Web frontend | The web interface for configuration and viewing data; the manual notes it usually runs on the same machine as the server |
| Zabbix agent / agent 2 | Installed on monitored machines to watch local resources and applications |
| Zabbix proxy (optional) | Collects data on the server's behalf to spread load and monitor remote sites |
There are two agents. The comparison table in the manual shows the classic Zabbix agent written in C and running on Linux, Windows, macOS and several Unix systems. Zabbix agent 2 is written in Go, runs on Linux and Windows, collects every metric through plugins, can run checks concurrently and has a persistent buffer (a local SQLite file that holds values while the server or proxy is unreachable) for active items, which the agent collects and sends without waiting for a request. Agent 2 lacks persistent files for log items, and on Linux it runs in the background only under systemd.
A Zabbix proxy suits branches and networks with no local administrator. When proxies do the collecting, the server uses less CPU and disk I/O. Plan for its database: a proxy needs its own, separate from the server's (SQLite, MySQL or PostgreSQL).
What can Zabbix collect data from?
Zabbix collects data through items; each item defines one value and the method used to get it, and Zabbix supports both polling and receiving pushed data (trapping). Commonly used types from the 8.0 item type list:
- Zabbix agent: CPU, memory, disks, processes, services and log files on the host
- SNMP agent and SNMP trap: switches, routers, firewalls, UPS units and other SNMP devices
- IPMI agent: server hardware status over IPMI
- Simple check: agentless checks run from the server or proxy, such as ICMP ping and whether a service's TCP port accepts connections, plus VMware items
- HTTP agent: HTTP endpoints and APIs, including Prometheus-format metrics
- Database monitor: SQL queries over ODBC
- JMX agent: Java applications
- Others: SSH agent, Telnet agent, Zabbix trapper, Calculated, Dependent, Script, Browser item and Telemetry query
There is no separate "Prometheus" item type. The manual uses an HTTP agent master item pointing at the metrics endpoint, plus dependent items with the "Prometheus pattern" or "Prometheus to JSON" preprocessing step to extract values.
From host to alert: a Linux disk filling up
Zabbix configuration follows a fixed order: host, then item, then trigger, then action. The manual states that you must create a host before an item, and you must have a trigger to create an action.
- Host: the machine or device to watch, such as a Linux server with an agent installed
- Item: the value collected, such as free space per filesystem
- Trigger: the condition treated as a problem, such as free space below a threshold your team sets, with a severity
- Action: what happens when the trigger enters PROBLEM, such as messaging the team that owns the server and escalating if nobody responds
You do not create disk items one filesystem at a time. Low-level discovery finds filesystems and network interfaces and creates items, triggers and graphs from prototypes. A template is a set of items, triggers and discovery rules applied to many hosts; a change on the template propagates to every linked host, and Zabbix ships ready-made templates. For adding many hosts, network discovery scans for hosts and services, and active agent autoregistration lets agents register themselves.
The 8.0 media types are Email, Push notification, SMS, Custom script and Webhook. Zabbix ships predefined webhook media types for Telegram and LINE, among others such as Slack and Discord. LINE is a messaging app widely used in Thailand, which is why Thai teams often want alerts there.
Older guides that send Zabbix alerts through LINE Notify no longer work: LINE ended LINE Notify on 31 March 2025 and points users to its Messaging API. The Zabbix LINE integration uses a Messaging API channel access token and sends to a userId, groupId or roomId.
What Zabbix does, and what it is not designed for
Zabbix starts from metrics and availability: is a value beyond its threshold, is a host or service still responding, and who needs to know. Collecting logs from many sources into one place for search and analysis is the job of a dedicated log platform such as Graylog.
Zabbix can read logs within limits. The agent's log[] and logrt[] items watch named log files, including rotated ones, and alert when they contain given strings or patterns; they must be Zabbix agent (active) items. That suits catching known messages in known files, not searching past logs across every machine.
Zabbix 8.0 adds application performance monitoring based on OpenTelemetry, with Traces, Metrics and Logs views. The Zabbix server cannot receive telemetry; it is written to a telemetry data source by a Zabbix proxy with APM enabled or by an OpenTelemetry collector. Using it means adding that data source and a proxy or collector, so test it with your own workload before deciding whether it replaces an existing log tool.
Graylog describes itself as a SIEM and log analytics platform that collects, parses, searches, alerts on and visualises logs from many sources. Graylog Open is free under the Server Side Public License (SSPL), a source-available licence, unlike Zabbix's AGPLv3.
| Need | Fitting tool | Why |
|---|---|---|
| Know when a host, network device or service is abnormal or down | Zabbix items and triggers | Collects on a schedule, compares with thresholds and alerts |
| Alert when one log file contains a known message | Zabbix log[] / logrt[] (active agent) | No need to ship the log off the host |
| Search and analyse past logs from many hosts and systems | Graylog | Built for central collection, parsing and search |
| Monitor a branch or isolated network | Zabbix proxy | Collects for the server and forwards |
| Read metrics from an application exposing a Prometheus endpoint | Zabbix HTTP agent with Prometheus preprocessing | Uses the same triggers and alerts as other metrics |
Zabbix and Graylog therefore answer different questions: "is something wrong?" and "what happened?". Used together, a Zabbix alert tells you which host failed and when, and you use that host and time window to find the cause in Graylog. For running both together, see how we deploy Zabbix with Graylog.
Compared with Prometheus: Prometheus is an open source monitoring and alerting toolkit that stores metrics as labelled time series, collects them with a pull model over HTTP, is queried with PromQL, and is visualised with Grafana or other API consumers. Zabbix supports both polling and trapping and bundles agents, SNMP, IPMI, a web interface, alerting and templates, storing data in a relational database (or history in ClickHouse or Elasticsearch). The two can coexist through the Zabbix Prometheus check described above.
Which Zabbix release should you run, and under what licence?
Production systems that must run for years should use an LTS (long-term support) release. Under the Zabbix release policy, LTS releases come every 1.5 years and are supported for five years: three years of full support and two years of limited support with critical fixes only. Standard releases come every six months and are supported for 12 months, which suits teams that want new features and can upgrade often.
| Release | Released | End of full support | End of limited support |
|---|---|---|---|
| Zabbix 8.0 LTS | 2026-11-05 | 2029-11-30 | 2031-11-30 |
| Zabbix 7.4 | 2025-07-01 | 2026-11-12 | 2027-05-31 |
| Zabbix 7.0 LTS | 2024-06-04 | 2027-06-30 | 2029-06-30 |
| Zabbix 6.0 LTS | 2022-02-08 | Ended 2025-02-28 | 2027-02-28 |
Source: Zabbix Life Cycle & Release Policy, checked 2026-11-11. Zabbix 7.2 is no longer listed as supported.
For a new installation as of that date, the choice is 7.0 LTS or 8.0 LTS; 7.4 does not suit a new system, because its full support ends on 2026-11-12. 8.0 is supported almost two and a half years longer. The UNIXDEV team's view is that systems which do not need 8.0's new features straight away can wait for some 8.0.x point releases before production. That is our judgement, not a Zabbix recommendation.
On licensing, Zabbix states that from 7.0 all versions are released under the GNU Affero General Public License version 3 (AGPLv3), while versions up to 6.4 are under GPLv2. Zabbix can be downloaded and installed for free (the licence page asks commercial users to consider buying technical support, without requiring it); if you modify the source and offer it as a service to others, have your legal team review the AGPLv3 terms first.
Before upgrading across versions, read the upgrade notes for every version you skip. The 8.0 manual supports direct upgrade to 8.0.x from 2.0.x onward, but the database upgrade may take a long time depending on its size. The database is the usual blocker: Oracle was deprecated as a backend in 7.0 and removed in 7.2, and 8.0 raised the minimum MySQL, MariaDB, PostgreSQL and TimescaleDB versions. A Zabbix installation on Oracle must move its database before upgrading past 7.0. Monitoring Oracle databases through Database monitor items is a separate matter and is not affected.
How to size the server and database
Start from the number of metrics, how often each is collected and how long data must be kept, not just the number of hosts, because database size depends on values per second and on the housekeeping policy.
The Zabbix 8.0 requirements page gives example hardware as a starting point, noting that "1 metric = 1 item + 1 trigger + 1 graph" is only an estimation rule, not a formula.
| Size | Metrics | CPU cores | Memory (GiB) |
|---|---|---|---|
| Small | 1,000 | 2 | 8 |
| Medium | 10,000 | 4 | 16 |
| Large | 100,000 | 16 | 64 |
| Very large | 1,000,000 | 32 | 96 |
The manual recommends a separate database server for large installations. Zabbix 8.0 supports MySQL/Percona, MariaDB and PostgreSQL (optionally with TimescaleDB); ClickHouse and Elasticsearch can store history, and SQLite is supported for proxies only. Supported version ranges change between Zabbix releases, so check the requirements page for the release you install.
Zabbix stores two kinds of data: history keeps every value, while trends keep hourly min, max, average and count for numeric data and need far fewer resources. The manual advises keeping history for the smallest possible number of days, with the example of 14 days of history and five years of trends; graphs of older periods use trend data.
The manual's history formula is days × (items ÷ refresh interval in seconds) × 24 × 3600 × bytes per value, at around 90 bytes for a numeric value and about 500 bytes for text or log values. Its example is 3,000 items collected every 60 seconds, or 50 values per second. The manual works this through to about 10.9 GB for 30 days of history, and about 2.2 GB per year (11 GB for five years) of trends at roughly 90 bytes per hourly trend record, before events. Treat these as an order of magnitude, not the size of your system.
Old data and data deleted by users are removed by the housekeeper, a periodic clean-up process, which is why the requirements page says the database grows and then stops growing at a level set by the housekeeper settings. With TimescaleDB, data is split into time-based chunks; with the history and trend override options enabled in housekeeping, Zabbix drops old data a chunk at a time and compression becomes available (only with TimescaleDB under the Timescale Community License, not the Apache 2.0 license).
Designing alerts the team keeps reading
A monitoring system that sends too many alerts gets muted or ignored. Zabbix has three tools for cutting alerts that need no action: trigger dependencies, severity levels and maintenance periods.
- Trigger dependencies: when a router fails, every host behind it becomes unreachable too. If those hosts' triggers depend on the router's trigger, a dependent trigger does not change state or send notifications while its parent is in PROBLEM, so the team is alerted only to the root cause. Zabbix has no host-level dependencies; trigger dependencies are used instead.
- Severity: Not classified, Information, Warning, Average, High and Disaster. Action conditions and per-user media settings decide which severities reach whom, and through which channel.
- Maintenance: suppresses problems during predefined periods such as patch windows, either with or without data collection.
Points to know about maintenance:
- Notifications pause only if the action has "Pause operations for suppressed problems" set.
- If any host in a trigger expression is not in maintenance, the notification is still sent.
- Problems that start during maintenance get no recovery notification.
The rule that applies everywhere: every alert needs an owner and must be something a person can act on. If nobody needs to do anything about an alert, lower its severity, move it to a dashboard or remove it.
Getting started: what to monitor first and a pre-production checklist
Start from what users feel when it breaks, then work down to host resources. An order that suits most organisations: user-facing services (web, APIs, email) → the servers and databases behind them (CPU, memory, disk, processes) → network devices between users and services → backups and scheduled jobs.
Install from the Zabbix download page, which generates installation instructions after you choose the version, operating system, component, database and web server, and also offers containers, an appliance and Zabbix Cloud. The manual recommends official Zabbix packages over those shipped with the operating system.
- Choose an LTS release, record its end of full support in your plan and schedule upgrades.
- Choose a database from the list supported by that release, on a separate server if the installation is large.
- Estimate metrics and collection intervals, calculate history and trend size from the manual's formulas, and set housekeeping to match.
- Place proxies to match the network, such as branches and segregated networks, and give each proxy its own database.
- Choose agent or agent 2 per operating system and what you need to monitor.
- Use templates and discovery that cover the real devices instead of creating items one by one.
- Set trigger dependencies for network devices and decide which severities reach whom, through which channel.
- Test every alert path end to end and define maintenance windows for planned work.
- Decide where logs live; if you need to search logs across many hosts, plan a separate log platform.
UNIXDEV has worked with Zabbix and Graylog since 2014. If you want help designing, deploying or operating monitoring and logging, see Zabbix + Graylog observability and our Zabbix and Graylog capability.
Sources and further reading
- Zabbix 8.0 manual — What is Zabbix · Zabbix overview · What's new in Zabbix 8.0
- Zabbix Life Cycle & Release Policy · Zabbix License
- Zabbix agent 2 · Agent comparison · Zabbix proxy
- Item types · Prometheus checks · Log file monitoring
- Templates · Discovery
- Trigger dependencies · Trigger severity · Maintenance
- Media types · Webhook · LINE integration · Telegram integration
- LINE Notify — End of service announcement
- Zabbix 8.0 — APM
- Zabbix 8.0 requirements · History and trends · Housekeeping · TimescaleDB setup
- Zabbix 8.0 — Upgrade procedure · Upgrade notes for 7.2.0
- Zabbix download · Installation from packages: Debian/Ubuntu
- Graylog — What is Graylog? · Graylog Open
- Prometheus — Overview
- Related: DevOps and the hidden cost of manual delivery
- Related: A slow website needs a performance investigation, not just a bigger server
- Related: Legacy systems past end of support: reducing risk until you modernize
- All articles on DevOps and enterprise system operations
Sources checked on 2026-11-11
How we checked: based on the primary sources above, reviewed by the UNIXDEV team